Category Archives: Observatories

New AAO video: Rainbow Fingerprints

Have you ever wondered how telescopes collect the light of the stars to be later analyzed by the astronomers? This new AAO video, entitled Rainbow Fingerprints shows how this is done at the Anglo-Australian Telescope (AAT). The video was produced by AAO Astronomer and Outreach Officer Amanda Bauer, and I have collaborated providing not only the sequences of the AAT outside and inside the dome (which were extracted from my timelapse A 2dF night at the AAT) but also providing comments during the production process.

Video “Rainbow Fingerprints” showing how the light of distant galaxies in collected by the Anglo-Australian Telescope and directed to the AAOmega spectrograph using optical fibres. More information in the AAO webpage Rainbow Fingerprints. Credit: AAO, movie produced by Amanda Bauer (AAO).

The light coming from distant galaxies is first collected using the primary mirror of the telescope, which has a diameter of 4 meters, and then it is sent using optical fibres (the 2dF system) to a dark room where the AAOmega spectrograph is located. This spectrograph, which is a series of special optics, separates the light into its rainbow spectrum, in a similar way a prism separates white light into a rainbow. The separated light is later focussed onto the CCD detector. Finally the video reveals the science quality spectra for two different types of galaxies, one spiral (top panel) and one elliptical (bottom panel), using actual data obtained with the AAT and the AAOmega spectrograph. The information codified in the rainbow fingerprint identifies each galaxy unambiguously: distance, star formation history, chemical composition, age, physical properties as the temperature or the density of the diffuse gas, and many more.

I hope you enjoy it!

Dissecting galaxies of the Local Universe with the CALIFA survey

DP ENGLISH: This story belongs to the series “Double Post” which indicates posts that have been written both in English in The Lined Wolf and in Spanish in El Lobo Rayado.

DP ESPAÑOL: Esta historia entra en la categoría “Doble Post” donde indico artículos que han sido escritos tanto en español en El Lobo Rayado como en inglés en The Lined Wolf.

The Calar Alto Legacy Integral Field spectroscopy Area (CALIFA) survey is a project that aims to obtain data of around 600 nearby galaxies using the PMAS (Potsdam Multi Aperture Spectrophotometer) instrument of the 3.5m Telescope at the Calar Alto Observatory (Almería, Spain). The CALIFA survey combines the advantages of two observational techniques: imaging (that provides detailed information on galactic structure) and spectroscopy (that reveals the physical properties of galaxies, such as their kinematics, mass, chemical composition or age). The CALIFA survey makes use of the Integral Field Spectroscopy (IFS) technique, that allows obtaining at the same time around a thousand of spectra per galaxy, hence getting simultaneously imaging and spectra of astronomical objects.

A galaxy is “dissected” in thousands small regions, each one having its particular spectrum (wavelength) when using Integral Field Spectroscopy (IFS) techniques. The result is getting a datacube: two axes (x and y) possess the spatial information (the image of the galaxy, which can also be separated in several colours) and the third axis (wavelength) keep the spectroscopic information. Credit: Marc White (RSAA-ANU).

The CALIFA Project allows not only to inspect the galaxies in detail, but it also provides with data on the evolution of each particular galaxy with time: how much gas and when was it converted into stars along each phase of the galaxy’s life, and how did each region of the galaxies evolve along the more than ten thousand million years of cosmic evolution

Thanks to these data, astronomers of the CALIFA team have been able to deduce the history of the mass, luminosity and chemical evolution of the CALIFA sample of galaxies, and thus they have found that more massive galaxies grow faster than less massive ones, and that they form their central regions before the external ones (inside-out mass assembly). CALIFA has also shed light on how chemical elements needed for file are produced within the galaxies or on the physical processes involved on galactic collisions, and it has even observed the last generation of stars still in their birth cocoon.

CALIFA “panoramic view” (also CALIFA’s “Mandala”) representation, consisting of the basic physical properties (all of them derived from the CALIFA datacubes) of a subsample of 169 galaxies extracted randomly from the 2nd Data Release. It shows 1) broad band images (top center), 2) stellar mass surface densities (upper right), 3) ages (lower right), 4) narrow band images (bottom center; emission lines: Hα [N II] 6584 Å, and [O III] 5007 Å), 5) Hα emission (lower left) and 6) Hα kinematics (upper left). The CALIFA logo is placed at the central hexagon. Credit: R. García-Benito, F. Rosales-Ortega, E. Pérez, C.J. Walcher, S. F. Sánchez & the CALIFA team.

Today, Oct 1st, the CALIFA Team (and I’m part of it) has released 400 IFS datacubes for 200 nearby galaxies, the 2nd Data Release (DR2). The data are publically available and can now be used by astronomers around the world. The second CALIFA Data Release provides the fully reduced and quality control tested datacubes of 200 objects in two different spectral configurations. Each datacube contains ~1000 independent spectra, thus in total the CALIFA DR2 comprises ~400,000 independent spectra (~1.5 millon after cube reconstruction). The scientific details of the data included in the CALIFA DR2 are described in this scientific paper lead by the Spanish astronomer Rubén García-Benito.

More information about the CALIFA survey and its DR2:

– Calar Alto Observatory Press Release: http://www.caha.es/an-unprecedented-view-of-two-hundred-galaxies-of-the-local-universe.html

– Scientific paper about CALIFA DR2: García-Benito et al. (2014): http://arxiv.org/abs/1409.8302

– CALIFA webpage: http://www.caha.es/CALIFA/public_html

– CALIFA DR2 webpage: http://califa.caha.es/DR2

Time-lapse: The Sky over Siding Spring Observatory

DP ENGLISH: This story belongs to the series “Double Post” which indicates posts that have been written both in English in The Lined Wolf and in Spanish in El Lobo Rayado.

DP ESPAÑOL: Esta historia entra en la categoría “Doble Post” donde indico artículos que han sido escritos tanto en español en El Lobo Rayado como en inglés en The Lined Wolf.

I’ve been waiting year and a half to finally see this happening. One of the displays I prepared for the Stories from Siding Spring Observatory Photo Exhibition (that was organized by staff of the Australian Astronomical Observatory (AAO) and originally released on 17th April 2013 at the Sydney Observatory), was a new time-lapse video compiling scenes showing all the telescopes at the Siding Spring Observatory (Coonabarabran, NSW, Australia) before the terrible bushfires that destroyed the Warrumbungle National Park and seriously affected the very same Observatory on 13th January 2013. However I couldn’t do this time-lapse video public until today, as it is the very first video to be included in the AAO Youtube channel. So here it is the time-lapse video “The Sky over Siding Spring Observatory:

Video time-lapse The Sky over Siding Spring Observatory. To enjoy it as its best, I strongly recommend you to see it at its highest resolution (FullHD) and full screen in a dark room. Credit: Video Credit: Ángel R. López-Sanchez (AAO/MQ), Music: Point of no return (Rogert Subirana).

I think this is the best time-lapse video I have created so far. It last 4:30 minutes and it compiles the best time-lapse sequences I obtained at Siding Spring Observatory between August 2011 and March 2013, during my support astronomer duties for the 4-metre Anglo-Australian Telescope (AAT). Telescopes at Siding Spring Observatory featured include the Uppsala Near Earth Object Survey Telescope, the UNSW Automated Patrol Telescope, the 2.3m ANU Telescope, 1.2m Skymapper ANU, the 1.2m UK Schmidt Telescope (AAO) and the very own Anglo-Australian Telescope (AAT).

Throughout the video, watch for several astronomical objects: our Milky Way Galaxy, the Large and Small Magellanic Clouds, the Moon rising and setting, the planets Venus, Mars, Jupiter and Saturn, Zodiacal Light, Earth-orbiting satellites, airplanes crossing the sky, the Pleiades and Hyades star clusters, the Coalsack and the Carina nebulae, and famous constellations like the Southern Cross, Taurus, Orion, and Scorpio.

The time-lapse technique consists of taking many images and then adding all to get a movie with a very high resolution. In particular, the camera CANON EOS 600D and two lenses (a 10-20 mm wide-angle lens and a standard 35-80 mm lens) were used to get the frames of this time-lapse video. Except for those frames taken during the sunset in the first scene, frames usually have a 30 seconds exposure time, with a ISO speed of 1600. Some few scenes were shot using 15 or 20 seconds exposure time. All sequences were created at 24 fps (frames per second), and hence a second in the movie corresponds to 12 minutes in real time for the majority of the scenes. In total, the video combines around 5800 individual frames. Processing each 10 – 20 seconds sequence took between five and six hours of computer time. Care was taken to remove artifacts and hot pixels from individual frames, minimize background noise, and get an appropriate colour/contrast balance.

I hope you like it. Comments and posting about it in social media are very welcome.

More information and previous time-lapses

Video in the AAO YouTube Channel.

AAO Webpage: Timelapse Video: The Sky Over Siding Spring Observatory (25th Sep 2014)

Timelapse video: The Sky over the Anglo-Australian Telescope (3rd May 2013).

Timelapse video: A 2dF night at the Anglo-Australian Telescope (7th May 2014).

A 2dF night at the Anglo-Australian Telescope

One of the most complex astronomical instruments nowadays available is the Two Degree Field (2dF) system at the Anglo-Australian Telescope (AAT, Siding Spring Observatory, NSW, Australia). The main part of 2dF is a robot gantry which allows to position up to 400 optical fibers in any object anywhere within a “two degree field” of the sky.

The 2dF instrument attached to the primary focus of the AAT. Note that the mirror of the telescope is opened. This image was chosen to be part of the Stories from Siding Spring Observatory Photo Exhibition the AAO organized last year.
Credit: Á.R.L-S.

392 optical fibers are fed to the AAOmega spectrograph, which allows to obtain the full optical spectrum of every object targeted by an optical fiber. The remaining 8 optical fibers are actually fibre-bundles and are used to get an accurate tracking of the telescope while astronomers are observing that field, which may last up to 3 hours. 2dF possesses two field plates: one located at the primary focus of the telescope and another at the position of the robot gantry. While a field is being observed in one plate, 2dF configures the next field on the other plate. A tumbling mechanism is used to exchange the plates. 2dF was designed at the AAO in the late 90s and, since then, it has been used by a large number of international astrophysicists. In a clear night, 2dF can obtain high-quality optical spectroscopic data of more than 2,800 objects.

Indeed, this sophisticated instrument has conducted observations for hundreds of astronomical projects, including galaxy surveys such as the 2dF Galaxy Redshift Survey, the WiggleZ Dark Energy Survey, and the Galaxy And Mass Assembly (GAMA), survey which is still on going and in which I actively participate. The optical fibers of 2dF can be also fed the new HERMES spectrograph, which is now starting the ambitious Galactic Archaeology with HERMES (GALAH) survey at the AAT. GALAH aims to observe around 1 million galactic stars to measure elemental abundances and measure stellar kinematics.

Frame of the time-lapse video “A 2dF night at the Anglo-Australian Telescope”. The 2dF robot gantry moving and positioning the optical fibers. Credit: Á.R.L-S.

How does 2dF move and position the optical fibers? A very nice way of explain it is using the time-lapse technique, that is, taking many images and then adding all to get a movie of the robot while moving and positioning the fibers. That is why in 2012 I decided to create the video, A 2dF night at the AAT, which assembles 14 time-lapse sequences taken at the AAT during September and November 2011 while I was working at the AAT as support astronomer of the 2dF instrument. Actually, this time-lapse video shows not only how 2dF works but also how the AAT and the dome move and the beauty of the Southern Sky in spring and summer. The time-lapse lasts for 2.9 minutes and combines more than 4000 frames obtained using a CANON EOS 600D provided with a 10-20mm wide-angle lens.

Time-lapse video “A 2dF night at the AAT”. I recommend to follow the link to YouTube and watch it at HD and full screen in a dark room. Credit: Á.R.L-S.

The video consists in three kinds of sequences created at 24 frames per second (fps). The first 3 sequences show how the 2dF robot gantry moves the optical fibers over a plate located at the primary focus of the telescope. Although in real life 2dF needs around 40-45 minutes to configure a full field with 400 fibers, the time-lapse technique allows to speed this process. The first 2 sequences have been assembled taking 1 exposure per second, therefore 1 second of the video corresponds to 24 seconds in real life. The third sequence considers an exposure each 3 seconds, and hence it shows the robot moving very quickly. The next four sequences show the movement of the telescope and the dome. All of them were obtained taking 2 images per second (a second in the movie corresponds to 12 seconds in real life). The long black tube located at the primary focus of the telescope is 2dF. The remaining sequences, all obtained during the night, were created taking exposures of 30 seconds, and hence each second in the video corresponds to 12 minutes in real life.

Frame of the time-lapse video “A 2dF night at the Anglo-Australian Telescope”. The AAT telescope, with 2dF (the long, black tube) attached at its primary focus, is prepared to start observing. Credit: Á.R.L-S.

Astronomical time-lapse videos allow to see the movement of the Moon, planets and stars in a particular position in the Earth, something that conventional videos cannot achieve. In particular, dim stars and faint sky features, such as the Milky Way with its bright and dark clouds and the Magellanic Clouds, can be now easily recorded. As in my first time-lapse video, The Sky over the AAT, I set the camera up at the beginning of the night, let it run, and check on its progress occasionally. I used at focal of f5.6 and an ISO speed of 1600 ISO for the night sequences.

Frame of the time-lapse video “A 2dF night at the Anglo-Australian Telescope”. The Magellanic Cloud rise while the Milky Way sets over the Anglo-Australian Telescope at Siding Spring Observatory on 3 Nov 2011. Some kangaroos can be seen in the ground. Credit: Á.R.L-S.

However, the procedure that took more time was processing the hundreds of individual photographies included in each sequence. In many cases, I needed more than 12 hours of computer time, including 3 or 4 iterations per sequence, to get a good combination of low noise and details of the sky, plus “cleaning” bad pixels or cosmic rays. In particular, for this video I tried hard to show the colours of the stars, a detail which is usually lost when increasing the contrast to reveal the faintest stars. In the last sequence of the video, Aldebaran and Betelgeuse appear clearly red, while the stars in the Pleiades and Rigel have a blue color.

Frame of the time-lapse video “A 2dF night at the Anglo-Australian Telescope”. A dark night at The Anglo-Australian Telescope (23 Sep 2011). Orion constellation is seen over the AAT dome. The red colour of Alderaban and Betelgeuse and blue colours of Pleiades and Rigel are clearly distinguished. Credit: Á.R.L-S.

As I did for my previous time-lapse, here I also included a sequence which shows the trails created by the stars as they move in the sky as a consequence of the rotation of the Earth. This sequence shows the Celestial Equator and stars at the South (top) and North (bottom) Celestial Hemisphere. Note that star trails have indeed many different colours. Other details that appear in this time-lapse video are clouds moving over the AAT, satellites and airplanes crossing the sky, the nebular emission of the Orion and Carina nebulae, the moonlight entering in the AAT dome, and kangaroos “jumping” in the ground.

Frame of the time-lapse video “A 2dF night at the Anglo-Australian Telescope”. Startrails over the Anglo-Australian Telescope on 23 Sep 2011. The colours of the stars are clearly seen in this image, which stacks 1h 6min of observing time. Credit: Á.R.L-S.

Finally, I chose an energetic soundtrack which moves with both 2dF and the sky. It is the theme Blue Raider of the group Epic Soul Factory, by the composer Cesc Villà. Actually, all sequences were created to fit the changes in the music, something that also gave me some headaches. But I think the result was worth all the effort.

SN2014J in M82 observed at the William Herschel Telescope

A week ago, on January 21st, the English astrophysicist Steve Fossey gave a telescope workshop for a group of undergraduate students (Ben Cooke, Tom Wright, Matthew Wilde and Guy Pollack) belonging to the University College of London (UCL). As usually happens in the British capital, the sky was practically covered by clouds. However, Fossey and his students used the automatic 35 cm telescope of the University of London Observatory to spot the famous starburst galaxy M 82. Located at 12 million light-years away in the constellation of Ursa Major (The Big Dipper), the galaxy M 82 hosts an intense star-formation burst, being its light dominated by young, hot, massive, blue stars. As consequence of this frenetic activity, M 82 possesses long jets of hot gas that has been expelled from the center of the galaxy. Therefore, it is not casual that the students chose this galaxy as a target for their assignment. While Fossey was centering the galaxy in the field of the telescope he realized that there was a bright star which should not be there. They checked that this new star was real using another telescope of the Observatory. As clouds were approaching, they quickly took some few images in different filters. The first analysis was doubtless: they had just discovered a supernova in the galaxy M 82.

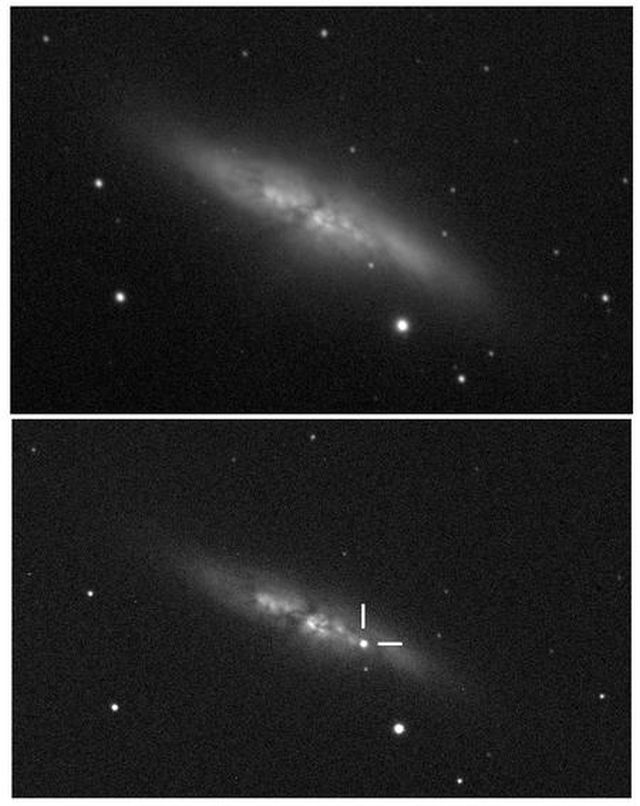
Discovery image of type Ia SN2014J in the starburst galaxy M82 (below) compared with an older image of the galaxy before the supernova exploded (top). The discovery image was obtained at 19:20 UT, 21st January 2014 using the automatic 35 cm telescope of the University of London Observatory. Credit: UCL/University of London Observatory/Steve Fossey/Ben Cooke/Guy Pollack/Matthew Wilde/Thomas Wright.

In just one day, amateur astronomers and professional astrophysicists used their telescopes to study M 82. These observations soon confirmed the discovery made by Fossey and his students. Actually, some astronomers even found that they had taken data of the galaxy and the supernova a week before the official discovery, but the new exploding stars was unnoticed by them. A couple of days after the discovery, a group of astrophysicists led by Yi Cao (Caltech) got the first optical spectrum of the supernova using the 3.5m ARC Telescope at Apache Point Observatory (New Mexico, USA). The analysis of this spectrum showed that the progenitor of the supernova was a white dwarf, and hence the explosion was classified as a type Ia supernova. The official name of this exploding star is SN 2014J. It has not reached its maximum brightness yet: when Fossey and his students discovered the supernova, it was 2 weeks before when we expect this happens. Right now it is so bright (around 10th magnitude) it is very easy to spot using a small amateur telescope. Perhaps even it can be seen using binoculars when the supernova reaches its maximum brightness in a week or so!

Hence, it is not difficult to understand that SN 2014J and M 82 have been the main astronomical news in the last week. Using the 4.2m William Herschel Telescope (WHT), which is part of the Isaac Newton Group, located at the Roque de los Muchachos Observatory in the beautiful island of La Palma (Canary Islands, Spain), the astrophysicists Manuel Moreno-Raya (CIEMAT, Spain) and Lluís Galbany (DAS/UC, Chile) have observed with great detail both the supernova and the galaxy. Between Thursday 23rd and Sunday 26th January they used the ISIS spectrograph, as well as the ACAM instrument (Auxiliary-Port Camera), of the WHT to get images and spectra of the supernova. I was continuously in touch with them as I’m part of their research team (actually, I’m co-supervising the PhD thesis which is conducted by Manu). I originally planned to travel to La Palma to be helping on these observations, however this was colliding with my support activities at the Anglo-Australian Telescope (Siding Spring Observatory, NSW, Australia). Manu and Lluís sent me the data as they were coming from the WHT, and I was reducing, combining, and getting the preliminary images and spectra of this object!

The image below shows the supernova SN 2014J and the galaxy M 82 using the data obtained with ACAM. I tried to get all the important details of this puzzling object: the dust lanes crossing the disc (dark-yellow), the strong star-formating bursts (blue) and even the filamentary structure of the super-galactic wind that M 82 possesses (in red). This feature is hot, ionized gas which has been expelled from the center of the galaxy and here it is seems perpendicular to the galactic disc. SN 2014J very brightly shines at the west (right) of M 82 galactic center.


Colour image of starburst galaxy M 82 with the type Ia supernova SN 2014J. M 82 lies at 12 million light years from us, in the Ursa Major constellation. The supernova is marked with two white lines. The data needed to get this image were taken using the ACAM instrument located at the Cassegrain focus of the 4.2m William Herschel Telescope (WHT) (Roque de los Muchachos Observatory, La Palma, Canary Islands, Spain). We got data in u, g, i, r, and Hα filters. Data coming from the u filter (2 x 200 seconds exposures) are colour-coded in blue; data in the g filter (3 x 100 seconds exposures) are colour-coded in cyan; data in the i filter (3 x 100 seconds exposures) are colour-coded in green; data in r filter (3 x 300 seconds exposures) are colour-coded in red. The majority of the data were obtained last 24th January, at 04:40 UT. Data in r and u filter were taken on 25th January, at around 06:00 UT. The Hα data (4 x 300 seconds exposures), which are colour-coded in red, were taken on 26th January at 06:30 UT. Data coming from the Hα filter clearly reveals the super-galactic wind of M 82. All data were reduced and combined using standard IRAF routines. The colour composition was obtained using Photoshop. The field of view is 8 arcminutes and the resolution 0.25 arcsec/pixels. However, the seeing was not too good, between 2 and 5 arcsec.
Credit: Observers: Manuel E. Moreno-Raya (CIEMAT, Spain) & Lluís Galbany (DAS / UC, Chile). Data processing and color image composition: Ángel R. López-Sánchez (AAO / MQ, Australia). Support astronomer: Chris Benn (ING, UK), Telescope Operator: José Norberto González (ING, UK). Research Team: Manuel E. Moreno-Raya (CIEMAT, Spain), Mercedes Mollá (CIEMAT, Spain), Ángel R. López-Sánchez (AAO / MQ, Australia), Lluís Galbany (DAS / UC, Chile),Aurelio Carnero (ON, Brazil), Inma Domínguez (UGR, Spain), & Pepe Vílchez (CSIC / IAA, Spain).

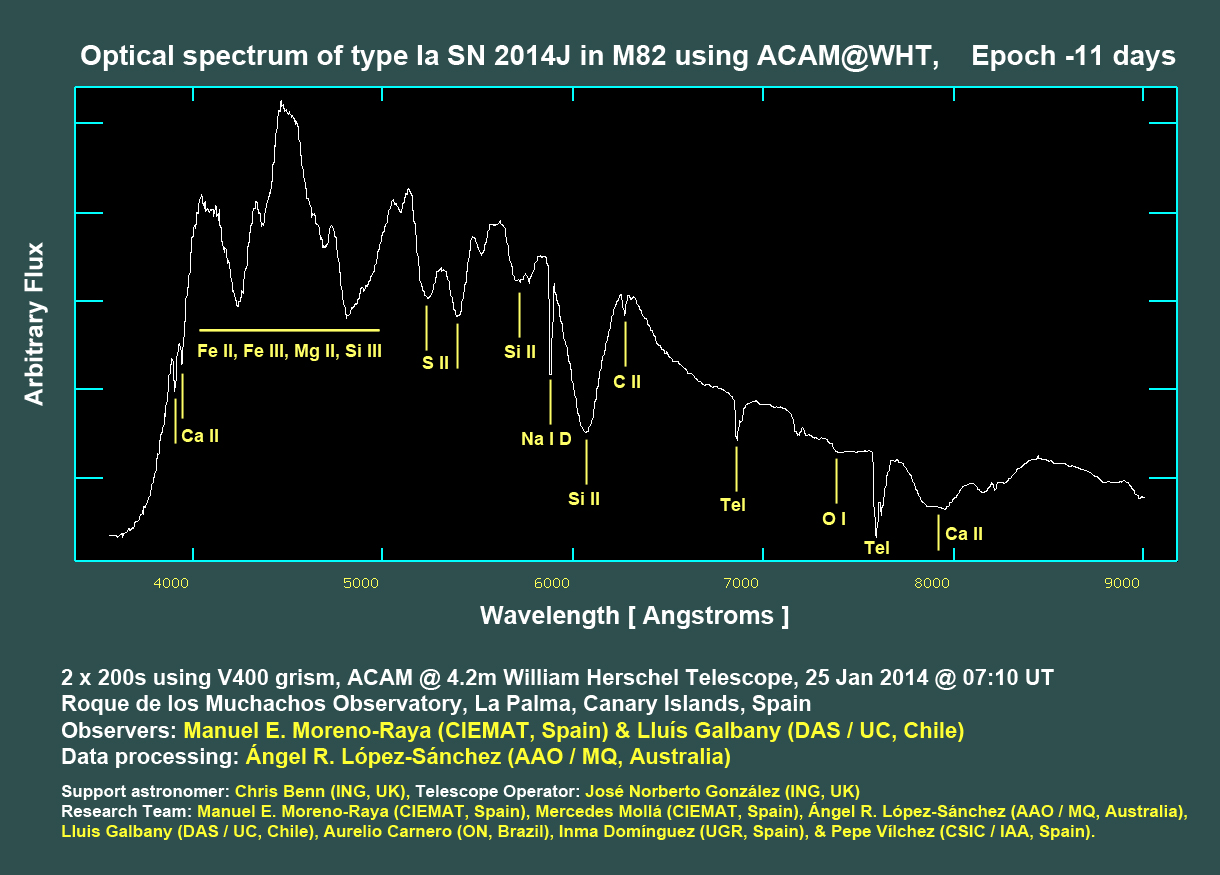
In addition, we have already analyzed the low-resolution spectrum of the SN 2014J obtained using ACAM. This spectrum gets all the optical range, between 3500 and 9500 Angstroms, and clearly identifies the object as a type Ia supernova. The main features are absorption bands of iron (Fe II and Fe III), magnesium (Mg II) and silicon (Si II) between 4000 and 5000 A. These bands actually are blends of absorptions due to these metallic elements. Indeed, astrophysicists expect the intensity of these bands will be changing as the supernova evolves, as the chemical abundances and ionization of each species vary as some elements are converted into others and more material coming from the center of the dead star is observed. Even so, it is a surprise to find these absorption bands almost 10 days before the supernova reaches its maximum brightness. The spectrum also shows absorptions of sulfur (S II) at 5240 and 5450 A, a strong absorption by silicon (Si II) at 6150 A, and absorptions of calcium (Ca II), sodium (Na I) and oxygen (O I). Some features are actually created in the Earth atmosphere and hence they do not belong to the supernova, these are labelled as “Tel” (from “Teluric lines”). However, the feature which interested us most was the carbon absorption (C II) at 6580. This line indicates that the progenitor of the supernova was a white dwarf composed by carbon and oxygen (as it happens in the majority of the white dwarf). However, it is uncommon to observe this line in type Ia spectra. This suggests that the surface of the white dwarf has not been completely burnt during the explosion. All absorption lines are found “blue-shifted”, that is, at shorter wavelengths that those expected. That is a consequence of the high speed at which the material is moving, expanding fast away from the dead star. The measurement of the C II and S II lines observed in our ACAM optical spectrum indicates that this material is moving at around 15 000 km/s!


Low-resolution optical spectrum of the type Ia supernova SN 2014J discovered in the galaxy M 82 obtained using the ACAM instrument at the Cassegrain focus of the 4.2m William Herschel Telescope (WHT) (Roque de los Muchachos Observatory, La Palma, Canary Islands, Spain). The intensity or relative flux (“Arbitrary Flux”, vertical axis) is plotted versus wavelength (“colour”, horizontal axis). The main features, which includes absorption lines of iron, magnesium, silicon, sodium, calcium, oxygen and carbon, are labelled. The spectrum combines two expositions of 200 seconds each using the ACAM V400 grism. The data were obtained last 25th January at 7:10 UT, which approximately corresponds to Epoch -11 days. It is expected the supernova reaches its maximum brightness in that time. The reduction of the data and the wavelength calibration was performed using standard IRAF routines.
Credit: Observers: Manuel E. Moreno-Raya (CIEMAT, Spain) & Lluís Galbany (DAS / UC, Chile). Data processing and color image composition: Ángel R. López-Sánchez (AAO / MQ, Australia). Support astronomer: Chris Benn (ING, UK), Telescope Operator: José Norberto González (ING, UK). Research Team: Manuel E. Moreno-Raya (CIEMAT, Spain), Mercedes Mollá (CIEMAT, Spain), Ángel R. López-Sánchez (AAO / MQ, Australia), Lluís Galbany (DAS / UC, Chile),Aurelio Carnero (ON, Brazil), Inma Domínguez (UGR, Spain), & Pepe Vílchez (CSIC / IAA, Spain).

Interestingly, the project that Manuel Moreno-Raya (CIEMAT, Spain) and his research team, composed by Mercedes Mollá (CIEMAT, Spain), Lluís Galbany (DAS / UC, Chile), Aurelio Carnero (ON, Brazil), Inma Domínguez (UGR, Spain), Pepe Vílchez (CSIC / IAA, Spain) and myself, was observing at the WHT was focused in obtaining deep, high-quality data of galaxies hosting type-Ia supernova. The idea is to quantify the physical and chemical properties of these host galaxies with the final aim of getting a better understanding of the parameters which control the brightness of these supernovae and apply these new measurements to improve the accuracy to very distant galaxies. This research is the main part of the PhD thesis project that Manu is conducting. Besides the observations of M 82 and the SN 2014J, we also got deep intermediate-resolution optical spectroscopy data of around 20 galaxies. These data still have to be analyzed in detail, something that will take months.

SN 2014J is the type-Ia supernova closest to the Earth since that Johannes Kepler observed in 1604. The Kepler’s Supernova actually exploded in our Galaxy, at just 20 thousands light-years from us, and it was so bright it was seen with the naked eye, being the brightest object in the sky after the Sun and the Moon. The type Ia supernova SN 1972e was also very close to us, as it exploded in the dwarf galaxy NGC 5253 (*). NGC 5253, which lies at a distance of 13 million light years, is in some way a similar object to M 82, as it also hosts a very powerful star-formation event. SN 1972e became the prototype object for the development of theoretical understanding of Type Ia supernovae, but this position may change with all the data that are coming from SN 2014J. What surprises will provide this new supernova? Can the new data be used to get a better understanding of the type Ia supernovae as a cosmological distance estimators and help to discover the nature of the mysterious dark energy which induces the expansion of the Universe? This research has just started.

UPDATE: Part of the information included in this post was used to prepare a telegram for ATel, The Astronomer’s Telegram, number 5827, Broad and narrow band imaging and spectroscopic follow up of SN2014J in M82, published on 28 Jan 2014; 18:30 UT.

(*) I should tell you many more things about the dwarf galaxy NGC 5253… It was my nightmare for some few years and after performing a very complete and detailed multi-wavelength analysis of this weird object I’m still not sure what is happening in there!