Tag Archives: 2014

Visions of a Total Lunar Eclipse within clouds

DP ENGLISH: This story belongs to the series “Double Post” which indicates posts that have been written both in English in The Lined Wolf and in Spanish in El Lobo Rayado.

DP ESPAÑOL: Esta historia entra en la categoría “Doble Post” donde indico artículos que han sido escritos tanto en español en El Lobo Rayado como en inglés en The Lined Wolf.

Last night half of the world (Eastern Asia, Australasia, Pacific and the Americas) enjoyed a total lunar eclipse. Again clouds were moving around over Sydney during all the day, I actually see the moon rising in the evening and in just few minutes moving into the clouds. The sky was almost completely covered when the eclipse started, at around 20:15 local time. I was fearing that, as it happened with the partial solar eclipse visible in Sydney last 29th April, I would not be able to get any useful image of the eclipse.

In any case, as I did for the occultation of Saturn by the Moon last May, I set up my telescope in the backyard and prepared everything for taking some photos of the event. Although I followed the eclipse almost completely, the clouds only allowed me to get good images in three occasions. These are the results:

Visions of a Total Lunar Eclipse within clouds.
8 October 2014 from Sydney. Data obtained using Telescope Skywatcher Black Diamond D = 80 mm, f = 600 mm, with a CANON EOS 600D at primary focus. The Red Moon compiles 40 frames taken at 1/3 s & ISO 800. Stacking using Lynkeos software, final processing with Photoshop. Credit: Á.R.L-S. (AAO/MQ)


It is not too much but I hope you like it. I will wait for the next total lunar eclipse to try to get the time-lapse sequence of all the event.

Dissecting galaxies of the Local Universe with the CALIFA survey

DP ENGLISH: This story belongs to the series “Double Post” which indicates posts that have been written both in English in The Lined Wolf and in Spanish in El Lobo Rayado.

DP ESPAÑOL: Esta historia entra en la categoría “Doble Post” donde indico artículos que han sido escritos tanto en español en El Lobo Rayado como en inglés en The Lined Wolf.

The Calar Alto Legacy Integral Field spectroscopy Area (CALIFA) survey is a project that aims to obtain data of around 600 nearby galaxies using the PMAS (Potsdam Multi Aperture Spectrophotometer) instrument of the 3.5m Telescope at the Calar Alto Observatory (Almería, Spain). The CALIFA survey combines the advantages of two observational techniques: imaging (that provides detailed information on galactic structure) and spectroscopy (that reveals the physical properties of galaxies, such as their kinematics, mass, chemical composition or age). The CALIFA survey makes use of the Integral Field Spectroscopy (IFS) technique, that allows obtaining at the same time around a thousand of spectra per galaxy, hence getting simultaneously imaging and spectra of astronomical objects.

A galaxy is “dissected” in thousands small regions, each one having its particular spectrum (wavelength) when using Integral Field Spectroscopy (IFS) techniques. The result is getting a datacube: two axes (x and y) possess the spatial information (the image of the galaxy, which can also be separated in several colours) and the third axis (wavelength) keep the spectroscopic information. Credit: Marc White (RSAA-ANU).

The CALIFA Project allows not only to inspect the galaxies in detail, but it also provides with data on the evolution of each particular galaxy with time: how much gas and when was it converted into stars along each phase of the galaxy’s life, and how did each region of the galaxies evolve along the more than ten thousand million years of cosmic evolution

Thanks to these data, astronomers of the CALIFA team have been able to deduce the history of the mass, luminosity and chemical evolution of the CALIFA sample of galaxies, and thus they have found that more massive galaxies grow faster than less massive ones, and that they form their central regions before the external ones (inside-out mass assembly). CALIFA has also shed light on how chemical elements needed for file are produced within the galaxies or on the physical processes involved on galactic collisions, and it has even observed the last generation of stars still in their birth cocoon.

CALIFA “panoramic view” (also CALIFA’s “Mandala”) representation, consisting of the basic physical properties (all of them derived from the CALIFA datacubes) of a subsample of 169 galaxies extracted randomly from the 2nd Data Release. It shows 1) broad band images (top center), 2) stellar mass surface densities (upper right), 3) ages (lower right), 4) narrow band images (bottom center; emission lines: Hα [N II] 6584 Å, and [O III] 5007 Å), 5) Hα emission (lower left) and 6) Hα kinematics (upper left). The CALIFA logo is placed at the central hexagon. Credit: R. García-Benito, F. Rosales-Ortega, E. Pérez, C.J. Walcher, S. F. Sánchez & the CALIFA team.

Today, Oct 1st, the CALIFA Team (and I’m part of it) has released 400 IFS datacubes for 200 nearby galaxies, the 2nd Data Release (DR2). The data are publically available and can now be used by astronomers around the world. The second CALIFA Data Release provides the fully reduced and quality control tested datacubes of 200 objects in two different spectral configurations. Each datacube contains ~1000 independent spectra, thus in total the CALIFA DR2 comprises ~400,000 independent spectra (~1.5 millon after cube reconstruction). The scientific details of the data included in the CALIFA DR2 are described in this scientific paper lead by the Spanish astronomer Rubén García-Benito.

More information about the CALIFA survey and its DR2:

– Calar Alto Observatory Press Release: http://www.caha.es/an-unprecedented-view-of-two-hundred-galaxies-of-the-local-universe.html

– Scientific paper about CALIFA DR2: García-Benito et al. (2014): http://arxiv.org/abs/1409.8302

– CALIFA webpage: http://www.caha.es/CALIFA/public_html

– CALIFA DR2 webpage: http://califa.caha.es/DR2

Time-lapse: The Sky over Siding Spring Observatory

DP ENGLISH: This story belongs to the series “Double Post” which indicates posts that have been written both in English in The Lined Wolf and in Spanish in El Lobo Rayado.

DP ESPAÑOL: Esta historia entra en la categoría “Doble Post” donde indico artículos que han sido escritos tanto en español en El Lobo Rayado como en inglés en The Lined Wolf.

I’ve been waiting year and a half to finally see this happening. One of the displays I prepared for the Stories from Siding Spring Observatory Photo Exhibition (that was organized by staff of the Australian Astronomical Observatory (AAO) and originally released on 17th April 2013 at the Sydney Observatory), was a new time-lapse video compiling scenes showing all the telescopes at the Siding Spring Observatory (Coonabarabran, NSW, Australia) before the terrible bushfires that destroyed the Warrumbungle National Park and seriously affected the very same Observatory on 13th January 2013. However I couldn’t do this time-lapse video public until today, as it is the very first video to be included in the AAO Youtube channel. So here it is the time-lapse video “The Sky over Siding Spring Observatory:

Video time-lapse The Sky over Siding Spring Observatory. To enjoy it as its best, I strongly recommend you to see it at its highest resolution (FullHD) and full screen in a dark room. Credit: Video Credit: Ángel R. López-Sanchez (AAO/MQ), Music: Point of no return (Rogert Subirana).

I think this is the best time-lapse video I have created so far. It last 4:30 minutes and it compiles the best time-lapse sequences I obtained at Siding Spring Observatory between August 2011 and March 2013, during my support astronomer duties for the 4-metre Anglo-Australian Telescope (AAT). Telescopes at Siding Spring Observatory featured include the Uppsala Near Earth Object Survey Telescope, the UNSW Automated Patrol Telescope, the 2.3m ANU Telescope, 1.2m Skymapper ANU, the 1.2m UK Schmidt Telescope (AAO) and the very own Anglo-Australian Telescope (AAT).

Throughout the video, watch for several astronomical objects: our Milky Way Galaxy, the Large and Small Magellanic Clouds, the Moon rising and setting, the planets Venus, Mars, Jupiter and Saturn, Zodiacal Light, Earth-orbiting satellites, airplanes crossing the sky, the Pleiades and Hyades star clusters, the Coalsack and the Carina nebulae, and famous constellations like the Southern Cross, Taurus, Orion, and Scorpio.

The time-lapse technique consists of taking many images and then adding all to get a movie with a very high resolution. In particular, the camera CANON EOS 600D and two lenses (a 10-20 mm wide-angle lens and a standard 35-80 mm lens) were used to get the frames of this time-lapse video. Except for those frames taken during the sunset in the first scene, frames usually have a 30 seconds exposure time, with a ISO speed of 1600. Some few scenes were shot using 15 or 20 seconds exposure time. All sequences were created at 24 fps (frames per second), and hence a second in the movie corresponds to 12 minutes in real time for the majority of the scenes. In total, the video combines around 5800 individual frames. Processing each 10 – 20 seconds sequence took between five and six hours of computer time. Care was taken to remove artifacts and hot pixels from individual frames, minimize background noise, and get an appropriate colour/contrast balance.

I hope you like it. Comments and posting about it in social media are very welcome.

More information and previous time-lapses

Video in the AAO YouTube Channel.

AAO Webpage: Timelapse Video: The Sky Over Siding Spring Observatory (25th Sep 2014)

Timelapse video: The Sky over the Anglo-Australian Telescope (3rd May 2013).

Timelapse video: A 2dF night at the Anglo-Australian Telescope (7th May 2014).

Seasons: Astronomy vs. Australia

Something that really shocked me when I started to live in Australia ~7 years ago was to hear everywhere that seasons start at the beginning of the corresponding month. That is, as today is Sep 1st, everyone in the radio / advertisements / news is welcoming Spring. And this, being an astronomer, believe me, hurts. Why? Because astronomically we are still in winter. Seasons are defined by Astronomy in a very accurate and precise way. This year Spring starts on September 23rd, 11:29 AEST (02:29 Universal Time). That is when that the Autumn Equinox happens, and the real moment Spring starts in the Southern Hemisphere (and Autumn/Fall starts in the Northern Hemisphere).

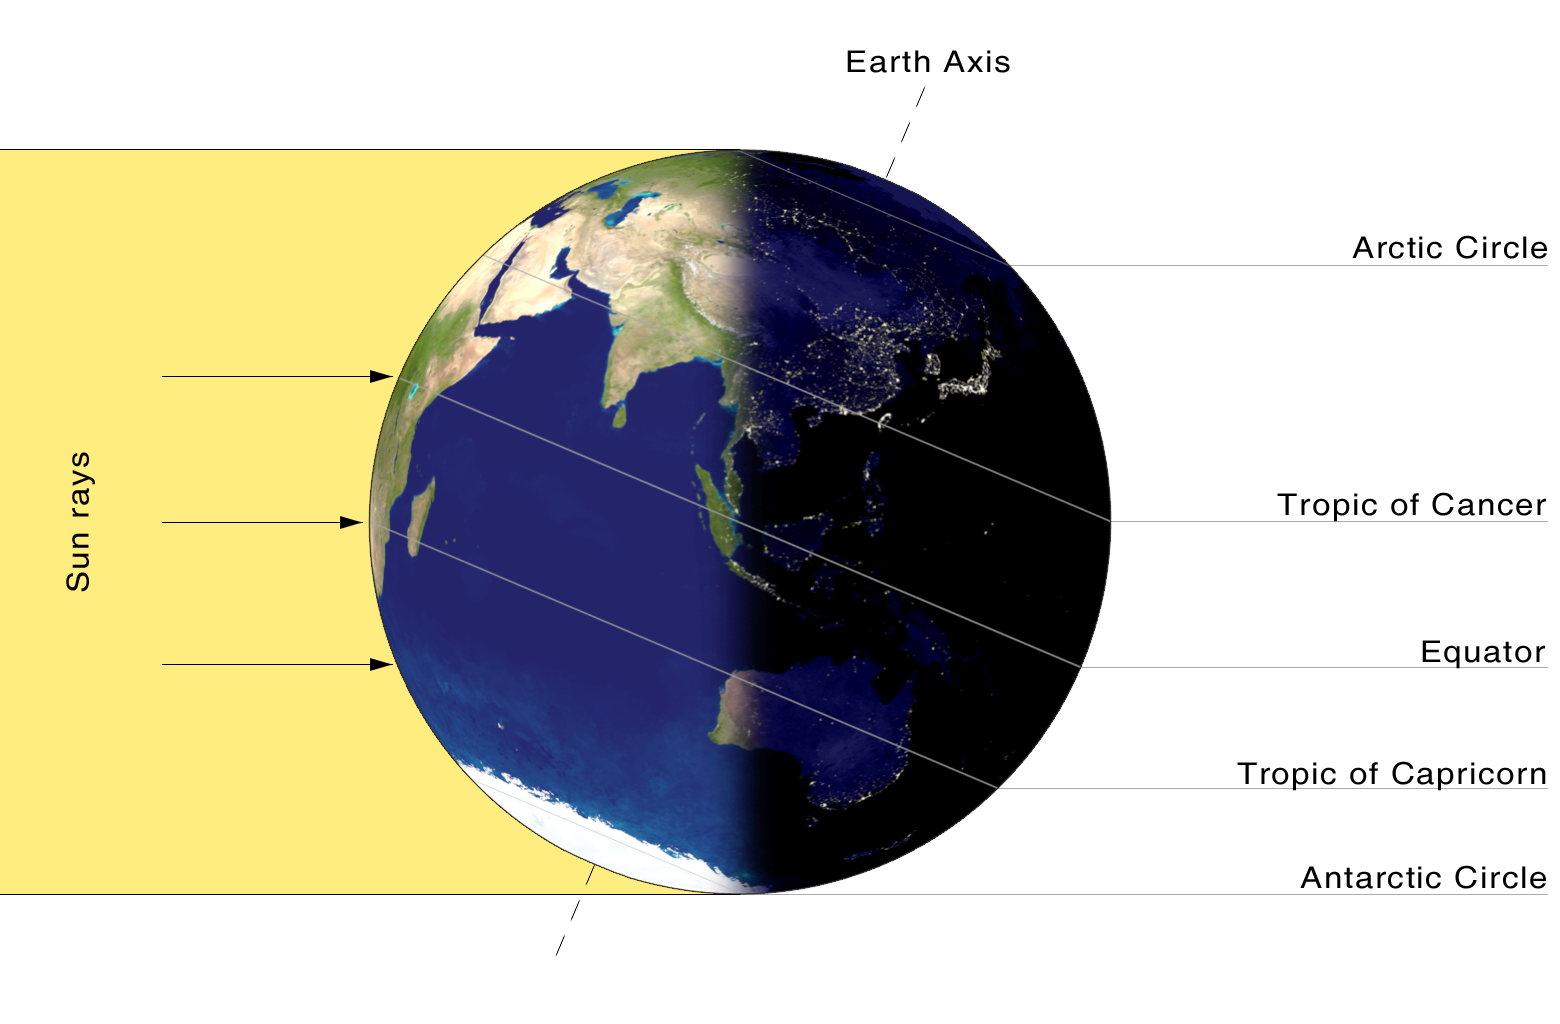
The seasons are caused by the combination of three astronomical factors: the Earth’s is a (almost perfect) sphere, the Earth’s orbit around the Sun, and the Earth’s axial tilt. As a consequence of these the Earth’s atmosphere is unequally heated by the Sun around the year at a given position. Therefore, the seasons are marked by the movement of the Earth around the Sun and, hence, which way the Earth is tilted with respect to the Sun. When the South hemisphere is tilted towards the Sun, the Sun’s rays strike the Earth at a steeper angle compared to a similar latitude in the North hemisphere. As a result, the radiation is distributed over an area which is less in the South hemisphere than in the North hemisphere. This means that there is more radiation per area to be absorbed in the South hemisphere, and therefore it is winter in the North hemisphere and summer in the South hemisphere.

Illumination of Earth by Sun at the southern solstice. Credit: Wikipedia


By astronomical definition, the precise timing of the seasons is determined by the exact times of transit of the Sun over the tropics of Cancer and Capricorn for the solstices and the times of the Sun’s transit over the Equator for the equinoxes, as specified in this figure:

Movement of the Earth around the Sun following an orbital ellipse (with eccentricity exaggerated for effect) and seasons. Equinoxes (20 or 21st March and 22nd or 23rd September) happen when the tilt of Earth’s axis neither inclines away from nor towards the Sun (green dotted line), and hence two points a the same latitude but a different hemispheres receive the same amount of energy from the Sun. In an equinox, the Sun is found at the zenith at the midday at the Equator. A solstice (20th or 21st June and 21st or 22nd December) happens when the tilt of the Earth’s axis has maximum effect (23.44º, red dotted line). At the June solstice the Sun is found at the zenith at the midday (just over our head!) at latitude 23.44º North, defining the Tropic of Cancer. Similarly at the December solstice this happens at 23.44º South, known as the Tropic of Capricorn. The periapsis (perihelion) and the apoapsis (aphelion) mark the nearest and the farthest points from the Sun, respectively (blue dotted line). Credit: Wikipedia


Therefore, in the South hemisphere, Spring starts with the Autumn Equinox, Summer with the Winter Solstice, Autumn with the Spring Equinox and Winter with the Summer Solstice. Of course, the names were given as correct for the North hemisphere.

Well, at least all of this is what Astronomy says. However, Governments and societies quite often decide to use their own definitions. Just checking this webpage of the Australian Bureau of Meteorology:

In Australia, the seasons are defined by grouping the calendar months in the following way:

1. Spring – the three transition months September, October and November.
2. Summer – the three hottest months December, January and February.
3. Autumn – the transition months March, April and May.
4. Winter – the three coldest months June, July and August.

These definitions reflect the lag in heating and cooling as the sun appears to move southward and northward across the equator. They are also useful for compiling and presenting climate-based statistics on time scales such as months and seasons.

Following these assumptions, Australia indeed enters in Spring today, which is funny because the majority of the countries (if not all) of the North hemisphere are still in Summer. In any case, for me it is Winter, and it will be winter till next on September 23rd, 11:29 AEST, when Spring, according to Astronomy, really starts.

Sequence of the occultation of Saturn by the Moon

DP ENGLISH: This story belongs to the series “Double Post” which indicates posts that have been written both in English in The Lined Wolf and in Spanish in El Lobo Rayado.

DP ESPAÑOL: Esta historia entra en la categoría “Doble Post” donde indico artículos que han sido escritos tanto en español en El Lobo Rayado como en inglés en The Lined Wolf.

Today Sunday I’ve used some of my free time to process the images I took last Wednesday, when Saturn was occulted by an almost full Moon. These are my two final images showing how Saturn first disappears behind the Moon and it reappears an hour later.

The Moon occults Saturn I: Saturn disappears.
14 May 2014 from Sydney. Data obtained using Telescope Skywatcher Black Diamond D = 80 mm, f = 600 mm, 20 mm eyepiece + CANON EOS 600D. All times are given in Universal Time, add 10 hours to get the local time in Sydney (AEST) that date. Images of Saturn obtained combining many frames at 1/60 and 1600 ISO using Lynkeos software + Photoshop. Image of the Moon obtained combining 20 best frames using Photoshop. Credit: Á.R.L-S. (AAO/MQ)


The Moon occults Saturn I: Saturn disappears.
14 May 2014 from Sydney. Data obtained using Telescope Skywatcher Black Diamond D = 80 mm, f = 600 mm, 20 mm eyepiece + CANON EOS 600D. All times are given in Universal Time, add 10 hours to get the local time in Sydney (AEST) that date. Images of Saturn obtained combining many frames at 1/100 and 1600 ISO using Lynkeos software + Photoshop. Image of the Moon obtained combining 11 best frames using Photoshop. Credit: Á.R.L-S. (AAO/MQ)

Getting nice images of Saturn was much trickier than I expected: the setup I used the other night it is not the best to observe Saturn, as more magnification and a good tracking are needed. On the other hand, the Moon was very bright so I had to use short exposition times, and hence Saturn appeared very dim. At the end I manage to get a kind of “master Saturn” combining the best frames I took during the night and later combine it with the data of each position to get the final view of Saturn at each time. For the Moon it was much easier, although you’ll perhaps realize that the second image is somewhat better than the first. The reason is that some parts of the Moon were actually saturated with the 1/60 seconds exposures, and that is why I later used 1/100 seconds for getting Saturn reappearing. In any case, I hope you like them.